2020:The Stock Market in Context
Everything was going well for the markets until the Coronavirus showed up. Fearing the effects of contagion of the virus, the governments paused their economies and investors nervousness increased considerably. From peaks in February to troughs a month later, North American markets fell 35%. From their March lows, propelled by low interest rates and the massive injection of liquidity by governments and central banks, markets have rebounded vigorously (over 40%) to levels close to the start of the year.
In both the United States and in Canada, the vast majority of stocks were down sharply in the first half of 2020, while the few exceptions, did drastically better. The containment imposed by government authorities had the effect of putting the economy on hold and favoring certain industries, notably those related to e-commerce and telework, to the detriment of others. Although COVID-19 will alter behaviors, we believe that the magnitude of stock market movements suggests that investors extrapolate that the current situation will persist for ever. This is evident by the over-representation of technology and precious metals stocks among the largest positive contributors to stock market returns both at home and south of the border.
As a result, in the United States, for the first 6 months of the year, the FAANGs and Microsoft returned more than 30% while in Canada, information technology (62.5%), commodities (15.5%) and consumer staples (1.4%) were the only three sectors with positive returns.
In Canada, propelled by its 151% return this year, Shopify has become the largest Canadian company. It thus surpassed Royal Bank's market capitalization despite never having been profitable, compared to $11.5 billion of net earnings for the Royal Bank last year. Without any expected profits for years to come and trading at more than 65x its revenues, it is difficult to justify such a valuation for this e-commerce stock.
Gold and precious metals stocks weigh around 11% of the Canadian market. They rose 44% in the first semester of the year, boosted by an 18% increase in the price of gold. At $1,800 USD an ounce, gold is 5% off its all-time high. Considering that 90% of the gold production is intended for the manufacture of jewelry and gold bars, the demand for gold is not rational and although its price tends to do well when nervousness surges, in the very long term its growth parallels inflation.
The strong performance of technology is it different this time?
In the longer term, over the past three (3) years, the US market has returned a very attractive 10.7% average per annum. Nevertheless, when we dig deeper, we notice that a tiny proportion of companies in the index, explain a huge proportion of returns. Indeed, the FAANGs and Microsoft, or 1.2% of the S&P 500 companies, have been responsible for 46% of the overall performance of the US stock market over the past three years. In Canada, the concentration is even more extreme as Shopify alone accounts for more than half of the S&P / TSX's performance over the same period.
These companies did experienced sturdy growth, however it may be worth remembering that while disruptive emerging growth companies often enjoy remarkably high growth rates when they establish themselves and dominate the market, their growth inevitably slows when they saturate their respective industries. This was the case for Nifty Fifty stocks of the 1970s, this was also the case for the idolized stocks of the technology bubble, and everything indicates that the same phenomenon is already well underway for contemporary growth stocks.
More specifically, we can wonder about two of the main vectors of growth driving these stocks: the shift of advertising budgets from traditional media to the web and the displacement of data storage from corporate servers to cloud computing. In the first case, advertising budgets are stagnating, so we can easily imagine that this growth trend favoring the web can only reach maturity and fade. As for the cloud, once the data transition to the cloud draws to a close, growth is expected to be significantly more modest.
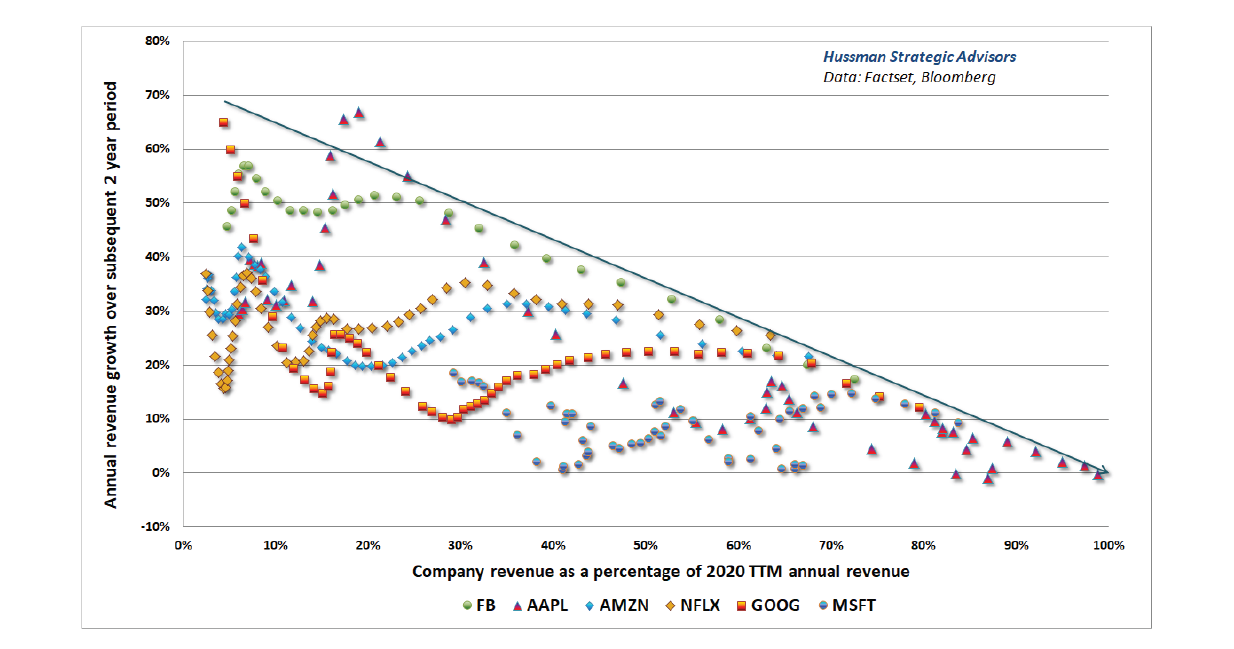
The graph below shows the two-year revenue growth for the FAANGs and Microsoft. Each point represents a fiscal quarter. The horizontal axis shows the quarterly revenues of businesses as a share of their current revenues.

You will notice that the growth rates of revenues were significantly stronger when these businesses were much smaller and that their growth decelerated considerably as their size increased.
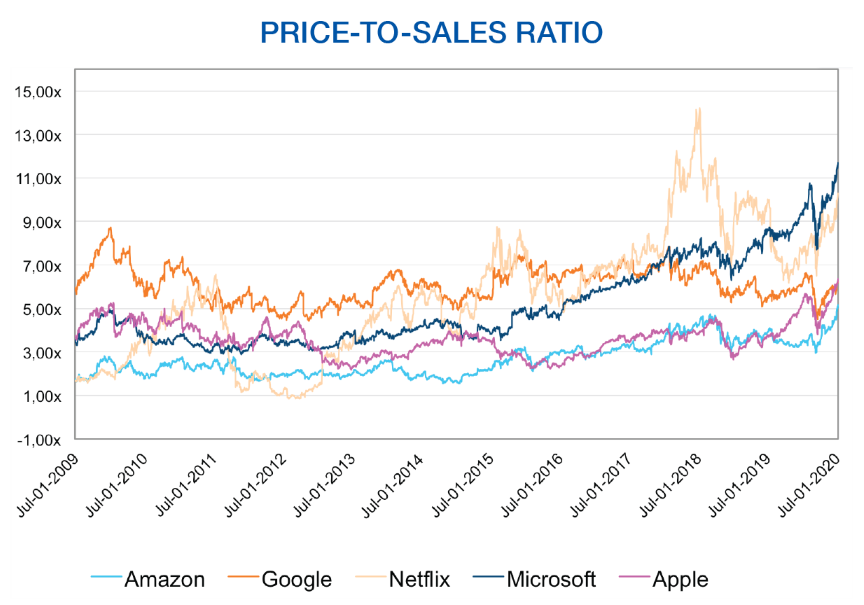
And yet, the price paid for these same companies follows an upward trend suggesting that the market extrapolates that past growth will continue indefinitely.

An historical point of view
Allard, Allard & Associés turned 25 on July 1, 2020. In its 25 years of more than enviable history and performance, it has only happened twice that its common sense investment process, which consists of buying profitable businesses, that generate strong free cash flow and are solid financially, at a good price, has had such difficult relative performance. Some will say that history does not repeat itself, yet the markets give us a strange sensation of déjà vu; as with the technological bubble at the turn of the millennium, technology stocks are trading as if their growth is expected to be eternal and one of them has surpassed the Royal Bank as the largest Canadian company and Warren Buffett is once again accused of having lost his touch...
Author(s)

